This function plots the OC (Optimal Classification) coordinates after applying an optional rotation matrix.
Usage
plot_oc_coords(
  obj,
  shapeVar = NULL,
  dropNV = FALSE,
  ptSize = 4,
  rotMat = diag(2)
)
Arguments
- obj
A list object containing the OC results. Typically, this comes from a function like
oc.- shapeVar
Optional. A variable to define the shape and color of points in the plot, typically a factor.
- dropNV
Logical. If
TRUE, rows with missing values in theshapeVarwill be dropped from the plot.- ptSize
Numeric. The size of the points in the plot.
- rotMat
A 2x2 rotation matrix. Defaults to the identity matrix (
diag(2)), which means no rotation.
Examples
# Example usage:
# Assume `rc` is an object containing legislative data
result <- oc(rc, dims=2, minvotes=20, lop=0.025, polarity=c(2,2), verbose=FALSE)
#>
#> Preparing to run Optimal Classification...
#>
#> Checking data...
#>
#> ... 112 of 1566 total members dropped.
#>
#> Votes dropped:
#> ... 34 of 889 total votes dropped.
#>
#> Running Optimal Classification...
#>
#> Generating Start Coordinates...
#> Running Edith Algorithm...
#> Getting normal vectors...
#> Getting legislator coordinates...
#> Getting normal vectors...
#> Getting legislator coordinates...
#> Getting normal vectors...
#> Getting legislator coordinates...
#> Getting normal vectors...
#> Getting legislator coordinates...
#> Getting normal vectors...
#> Getting legislator coordinates...
#> Getting normal vectors...
#> Getting legislator coordinates...
#> Getting normal vectors...
#> Getting legislator coordinates...
#> Getting normal vectors...
#> Getting legislator coordinates...
#> Getting normal vectors...
#> Getting legislator coordinates...
#> Getting normal vectors...
#> Getting legislator coordinates...
#>
#>
#> Optimal Classification completed successfully.
#> Optimal Classification took 225.94 seconds to execute.
#>
# Define a 45-degree rotation matrix
deg2rad <- function(x) x * pi / 180
rad45 <- deg2rad(45)
A <- matrix(c(cos(rad45), -sin(rad45), sin(rad45), cos(rad45)), nrow=2, ncol=2, byrow=TRUE)
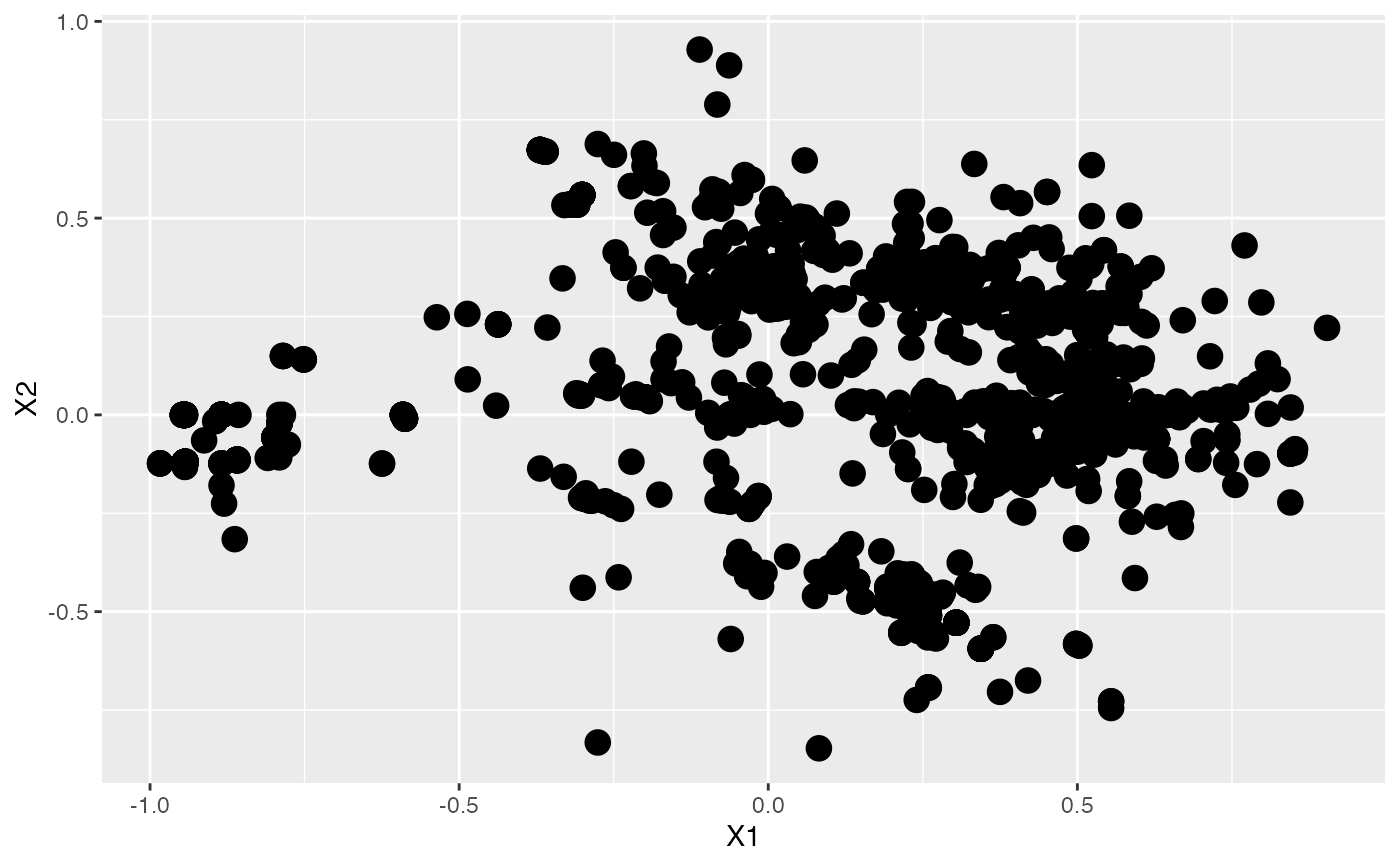
# Plot OC coordinates without rotation
plot1 <- plot_oc_coords(result)
print(plot1)
#> Warning: Removed 112 rows containing missing values or values outside the scale
#> range (`geom_point()`).
 # Plot OC coordinates with a 45-degree rotation
plot2 <- plot_oc_coords(result, rotMat=A)
# Plot OC coordinates with a 45-degree rotation
plot2 <- plot_oc_coords(result, rotMat=A)